Using Rate of Rise to your Advantage in a Production Setting
| Roast
Below we cover key takeaways from our chat with Anne and provide links to specific moments in the webinar for you to go back and learn more on the topic.
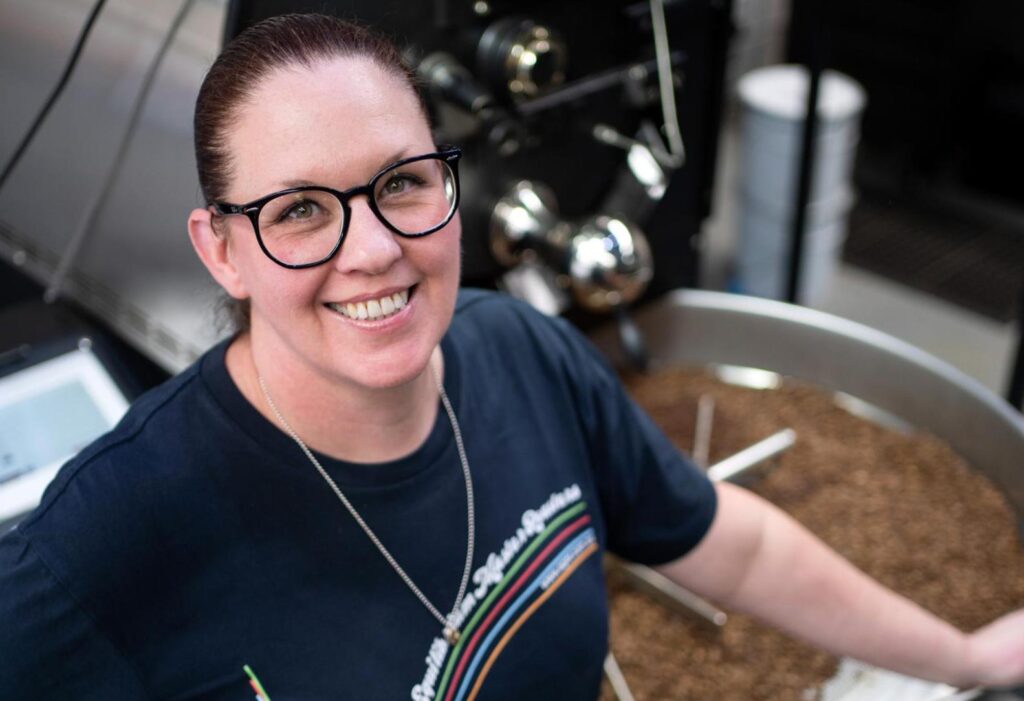
Anne Cooper “Roastress Coops” is a roaster and roast consultant based in Australia.
She is also the founder of Equillibirum Master Roasters.
Anne Cooper is a Cropster Ambassador and the founder of her own consulting business, Equilibrium Master Roasters (EQMR). Her experience is recognized worldwide. She is a frequent speaker at coffee events, a judge and contributor to articles and books. You can contact her directly or arrange a one on one session at https://www.eqmr.com.au/.
Watch the full webinar: Using Rate of Rise to your Advantage in a Production Setting.
What is Rate of Rise (watch here at 4:05)
- The Rate of Rise (RoR) is the speed at which the temperature of your beans is increasing/changing. It’s measured over a specific period of time, usually between 30 or 60 seconds. For example, an RoR of 5 over a period of 30 seconds means that the actual bean temperature is rising 5 degrees per 30 seconds or 10 degrees per minute. Measuring increases in temperature over time is an interesting challenge as you are really measuring velocity (yes, velocity as in rockets! Coffee roasting really includes rocket science).
- This is one reason Cropster users can set their preferred time expression, which defines how large the time period is for which the temperature increase is displayed. The time expression depends on your personal preference, you could compare it with how you look at the speed in your car. Are you used to looking at the speed in miles per hour or kilometers per hour? With Cropster, you can select the time expression in which the speed is displayed in, and how much detail the RoR shows. This is thanks to the introduction of 3 RoR settings (Recommended, Sensitive & Noise smoothing).
Understanding your hardware setup and noise (watch here at 6:36)
- The RoR is a significant metric used to map and evaluate a roast, and we are proud to say it has been over 10 years since we first developed it. Like all metrics, we know it has strengths and weaknesses. One strength is the amount of knowledge it helps us gain about a particular roast, roasting techniques, staying consistent, etc. A weakness is how it relies on variable equipment (machines, probes, power supplies, etc). People roast coffee on many different setups, and that creates additional challenges.
- Those equipment differences are important, especially when it comes to ‘noise’ which can be caused by the equipment itself. Some equipment presents a smoother curve based on things like type of probes, probe placement & thickness, and even connections and power (all these things can cause varying levels of electrical interference commonly referred to as ‘noise’). Understanding noise is as important as knowing your roast machine. It can change characteristics of the RoR and that can affect how you interpret the RoR when roasting. That’s why we invest in helping people understand the impact of their hardware on the data we present, and also why we have added three settings to Cropster to help them choose the best way to present the RoR for their roast machine.
Differences in Probes – matching profiles across different machines (watch here at 11:01)
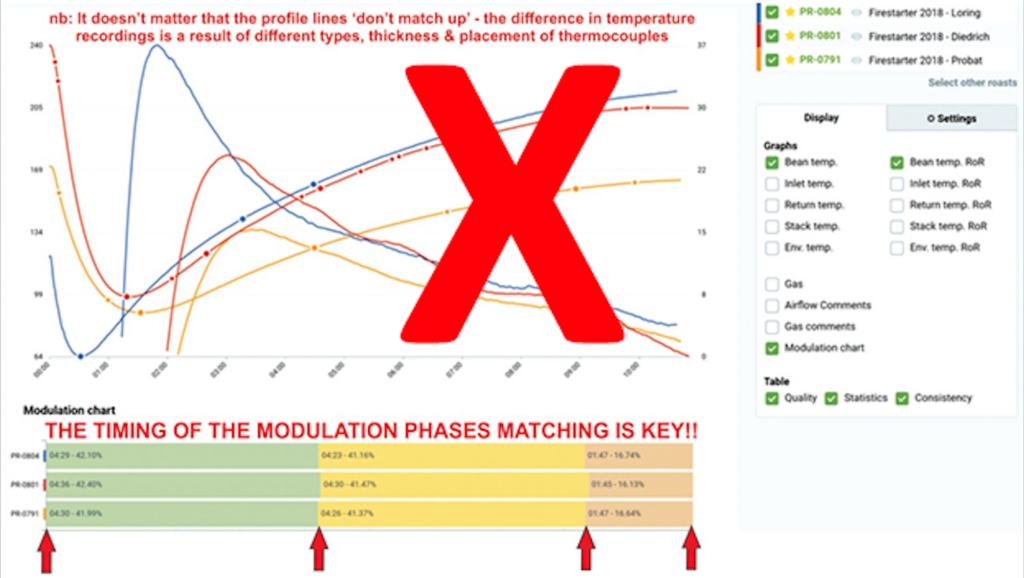
Comparison of phase/profile matching across three different roast machines:
Blue profile = Loring (1.5mm probe) / Red profile = Diedrich (3mm probe) / Yellow profile – Probat (6mm probe)
In testing, all coffees tasted the same because the timing of the phases were exactly the same. When wanting to match flavours across different machines, matching the roast ‘curve’ between different roasting systems should not be the goal because of probe differences – matching the phases & end roast colour is key.
Linear/Sequential cooking progression vs RoR lines/curves on screen (watch here at 22:54)
- Anne often reminds her clients to also focus on the linear/sequential cooking progression of the beans instead of just & only the lines on the screen. Her reminder to roasters is to ask themselves the simple question “Are you roasting the software or the coffee in the roaster?” – because, in roasting, we need to focus on both! The data & the sensory need each other.
- In the image below – both profiles were roasted for espresso – the roast curve on the left looks ‘perfect’ where the roaster was roasting by only focusing on achieving a 45-degree angle ‘straight’ descending RoR roast line but, despite this, it produced a much lower quality flavor than the roast on the right which doesn’t have the same straight ‘perfect’ RoR line.


Left curve: Low Body & Low Sweetness, Dry, Tart & Bitter Finish
Right curve: High Body & High Sweetness, Juicy Acidity, Balanced Finish
- How long you spend in each phase matters. The above roast examples were both roasted & intended for espresso – but looking at the left curve you’ll notice the coffee roasted quite fast through the first two phases of the roast relative to the gradual approach of the right curve.
- Anne points out that many roasters make the mistake of aiming to get their coffee to first crack and then focus on how long they will ‘develop’ the coffee instead of paying more attention to how the coffee was roasted up until/before first crack.
Rate of Rise settings
- One of Anne’s key tips for roasters is to adopt the use of the 60 second RoR interval/rate of expression setting. Her reasoning behind this is simple, practical and yet powerful. It all starts with her overall approach to coffee roasting: A roaster’s strategy should consist of specific time, temperature & RoR Rate goals connected to a key physical event throughout the roast. With this in mind, Anne’s reliance on temperature & RoR Rate set points is crucial to her success, and hence why she uses the 60 second rate of expression setting in Cropster. She explains that it makes it easier for her to map out where she is going to be as the roast progresses and if she will hit her desired temperatures (connected to a key physical event) at the right time with the right RoR Rate. “I know I have to be at a certain temperature (which is connected to a key physical event) & RoR Rate at a certain time, and with a 60 second rate of expression, I can easily plan ahead & then figure out/design what heat strategy changes I need to make in order to get to the right checkpoint/physical roasting event at the right time, temperature & rate.” This is as opposed to using something like 30 seconds for the rate of expression which (as explained in the beginning of this post) would mean the roaster would need to multiply by two in order to sync up the RoR read out into degrees per minute, making data interpretation difficult to use & plan a roast with.
- It is also super important to reiterate & remind roasters that, in the current Version 4 of Cropster, the Context of the RoR (now set to either Recommended, Sensitive or Smoothing) is not connected to the Rate of Expression (as it used to be in previous versions 1-3).
Anne Cooper’s RoR rate decision points (watch here at 27:48)
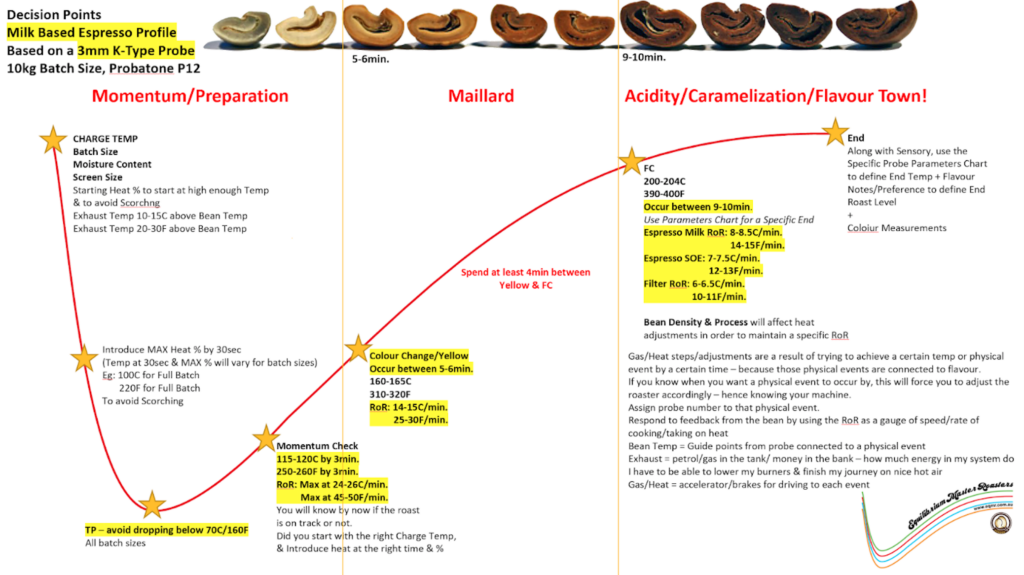
Key decision points during a coffee roast based based on 3 criteria:
Get to yellow between 5-6 minutes (160-165C, 310-320F) / Spend at least four minutes between yellow and first crack / Spend 3-3.30 minutes from first crack until the end – with each key event having a specific RoR rate
Note: Based on 3mm K type probe, 10kg batch size, (personal preference) milk based espresso profile
Anne also shares that it is important to focus on how many degrees you are moving after first crack and not just development time percentage. Both a 20F and 30F degree rise in bean temperature after first crack can still be achieved in a 20% development time ratio, so it is important to not just rely on the development ratio % when defining the overall roast profile – especially the end roast level. Roasting is all about time, degrees & roast colour. Once you have mapped out your heat strategy for the roast (in terms of being at a key physical event at the right time & temperature with the right RoR rate) you then need to have a time, degree & end temperature/colour strategy (or parameters) for after first crack to help finally define your desired end roast level/flavour preference. You can create these end roast parameters by summarizing the key data points from all your favourite roasts.
Rate of rise for exhaust (watch here at 39:09)
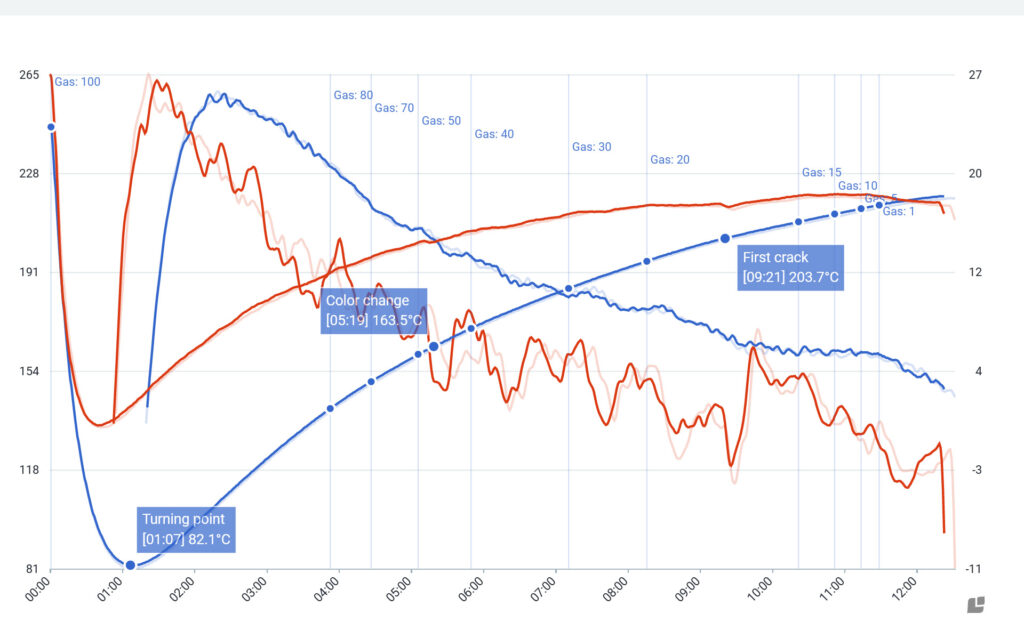
The rate of rise of your exhaust can also provide some good supporting context as to the current thermal energy of your roaster despite what your bean probe rate of rise might say. At this point in the webinar, Anne talks about how generally when approaching first crack – to avoid overcorrection, mis-managing heat strategies & losing the right RoR rate at a key point in the roast – when the bean temperature rate of rise spikes up she knows to ignore this as long as the exhaust rate of rise is declining. Without this exhaust RoR context, an incorrect adjustment of the heat can leave you with incorrect energy to hit your desired end temperature at the right time with the right RoR rate.
As you can read (and see in the video) the webinar was filled with solid and practical advice to help roasters of all levels of expertise. That’s exactly why we asked Anne for the insights she was kind enough to share. We’re already looking forward to her next webinar! If you’re interested in coffee roasting and would like to join one of webinars simply take a look at the webinars section of our website. Alternatively, sign up for our newsletter and we’ll keep you posted.
Follow Anne Cooper on Instagram @roastresscoops
Reach out to Anne for consulting: Equilibrium Master Roasters (EQMR)
Full youtube video here: Using Rate of Rise to your Advantage in a Production Setting
